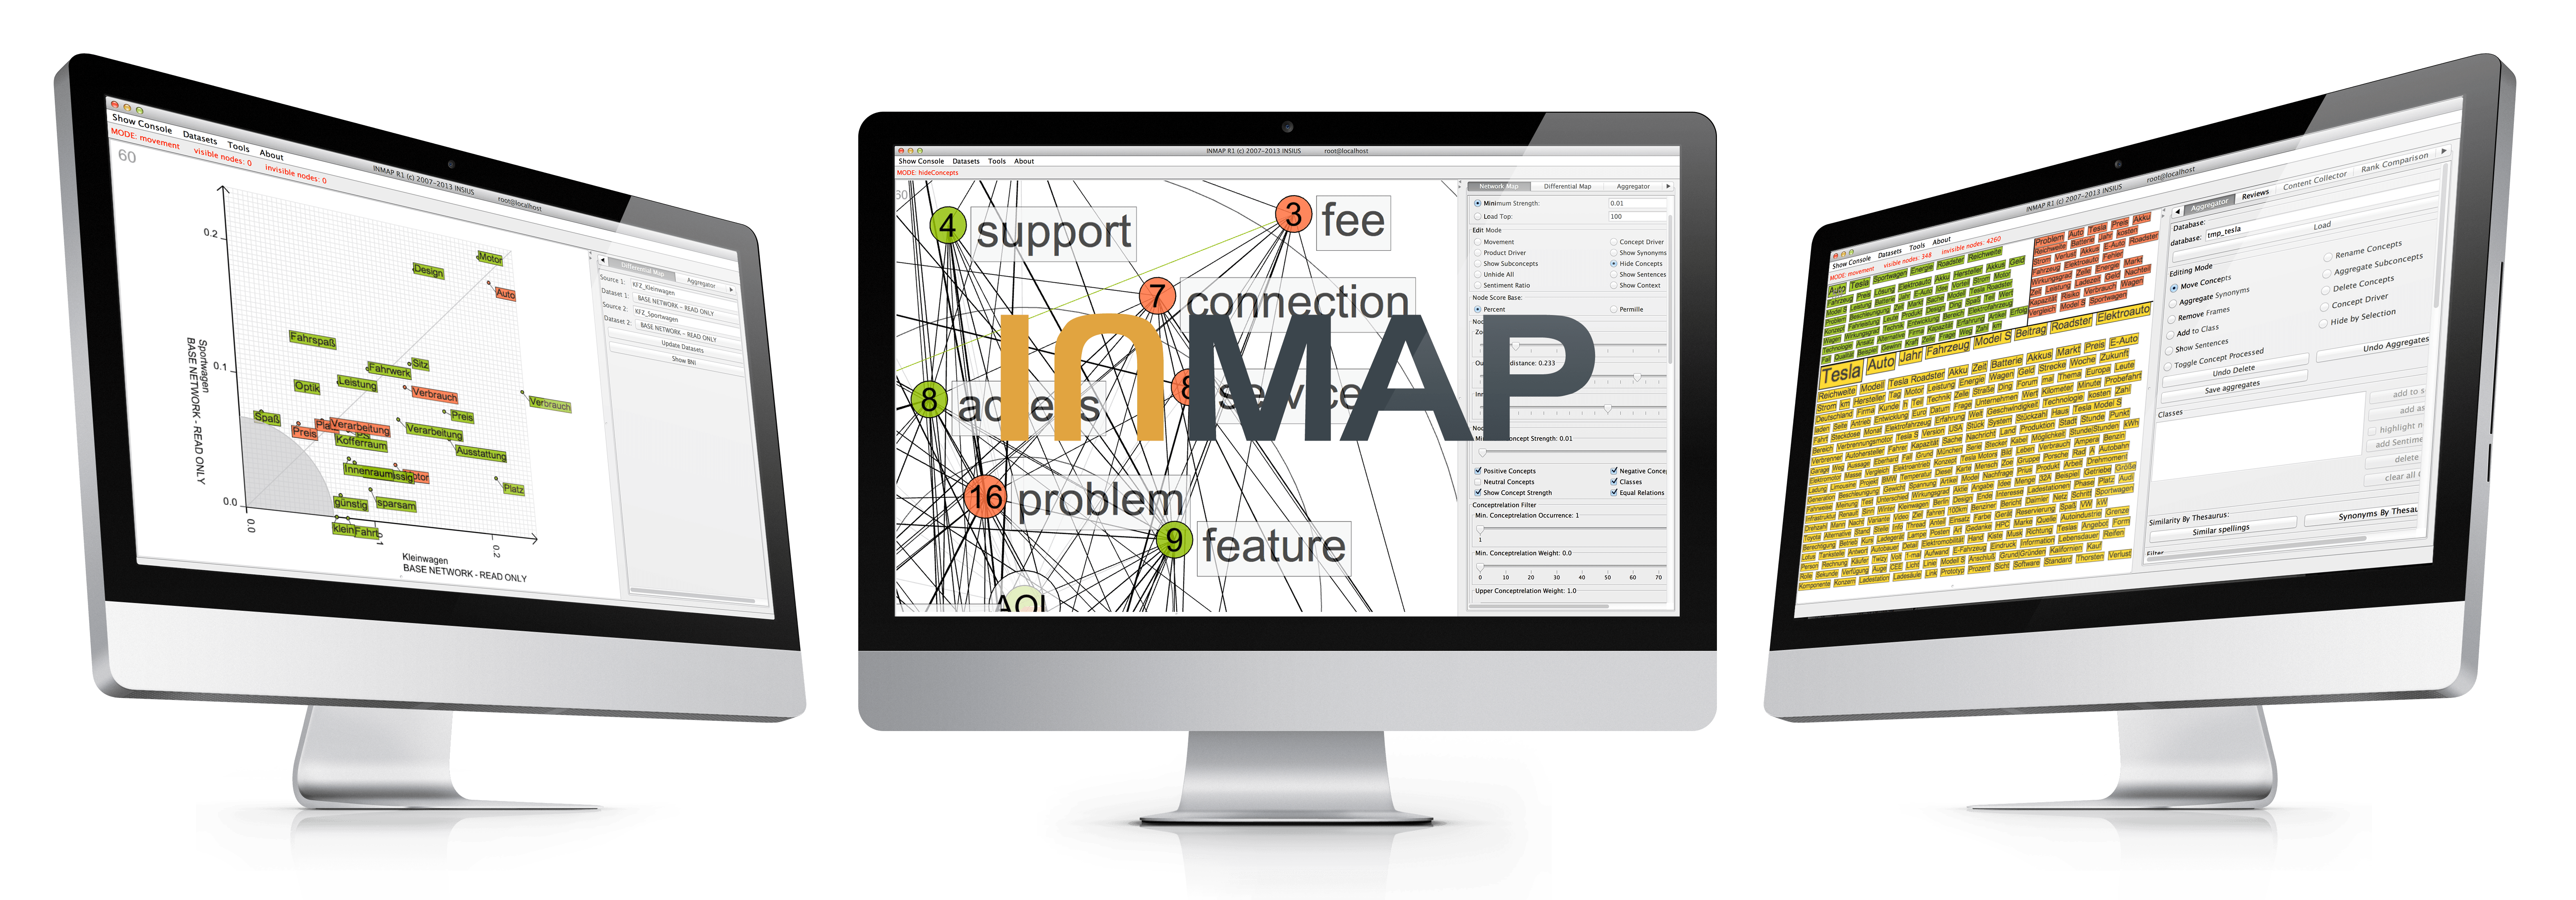
InMap is a highly automated analytics software that enables you to deeply analyze textual web content to elicit consumer perception regarding important topics, emotional attributes, and thought patterns.
Are you an (in-house) market researcher, agency or consultant and need verifiable, reliable, and comprehensive results? Is quality assurance your first commandment? Then, InMap is the right tool for you!
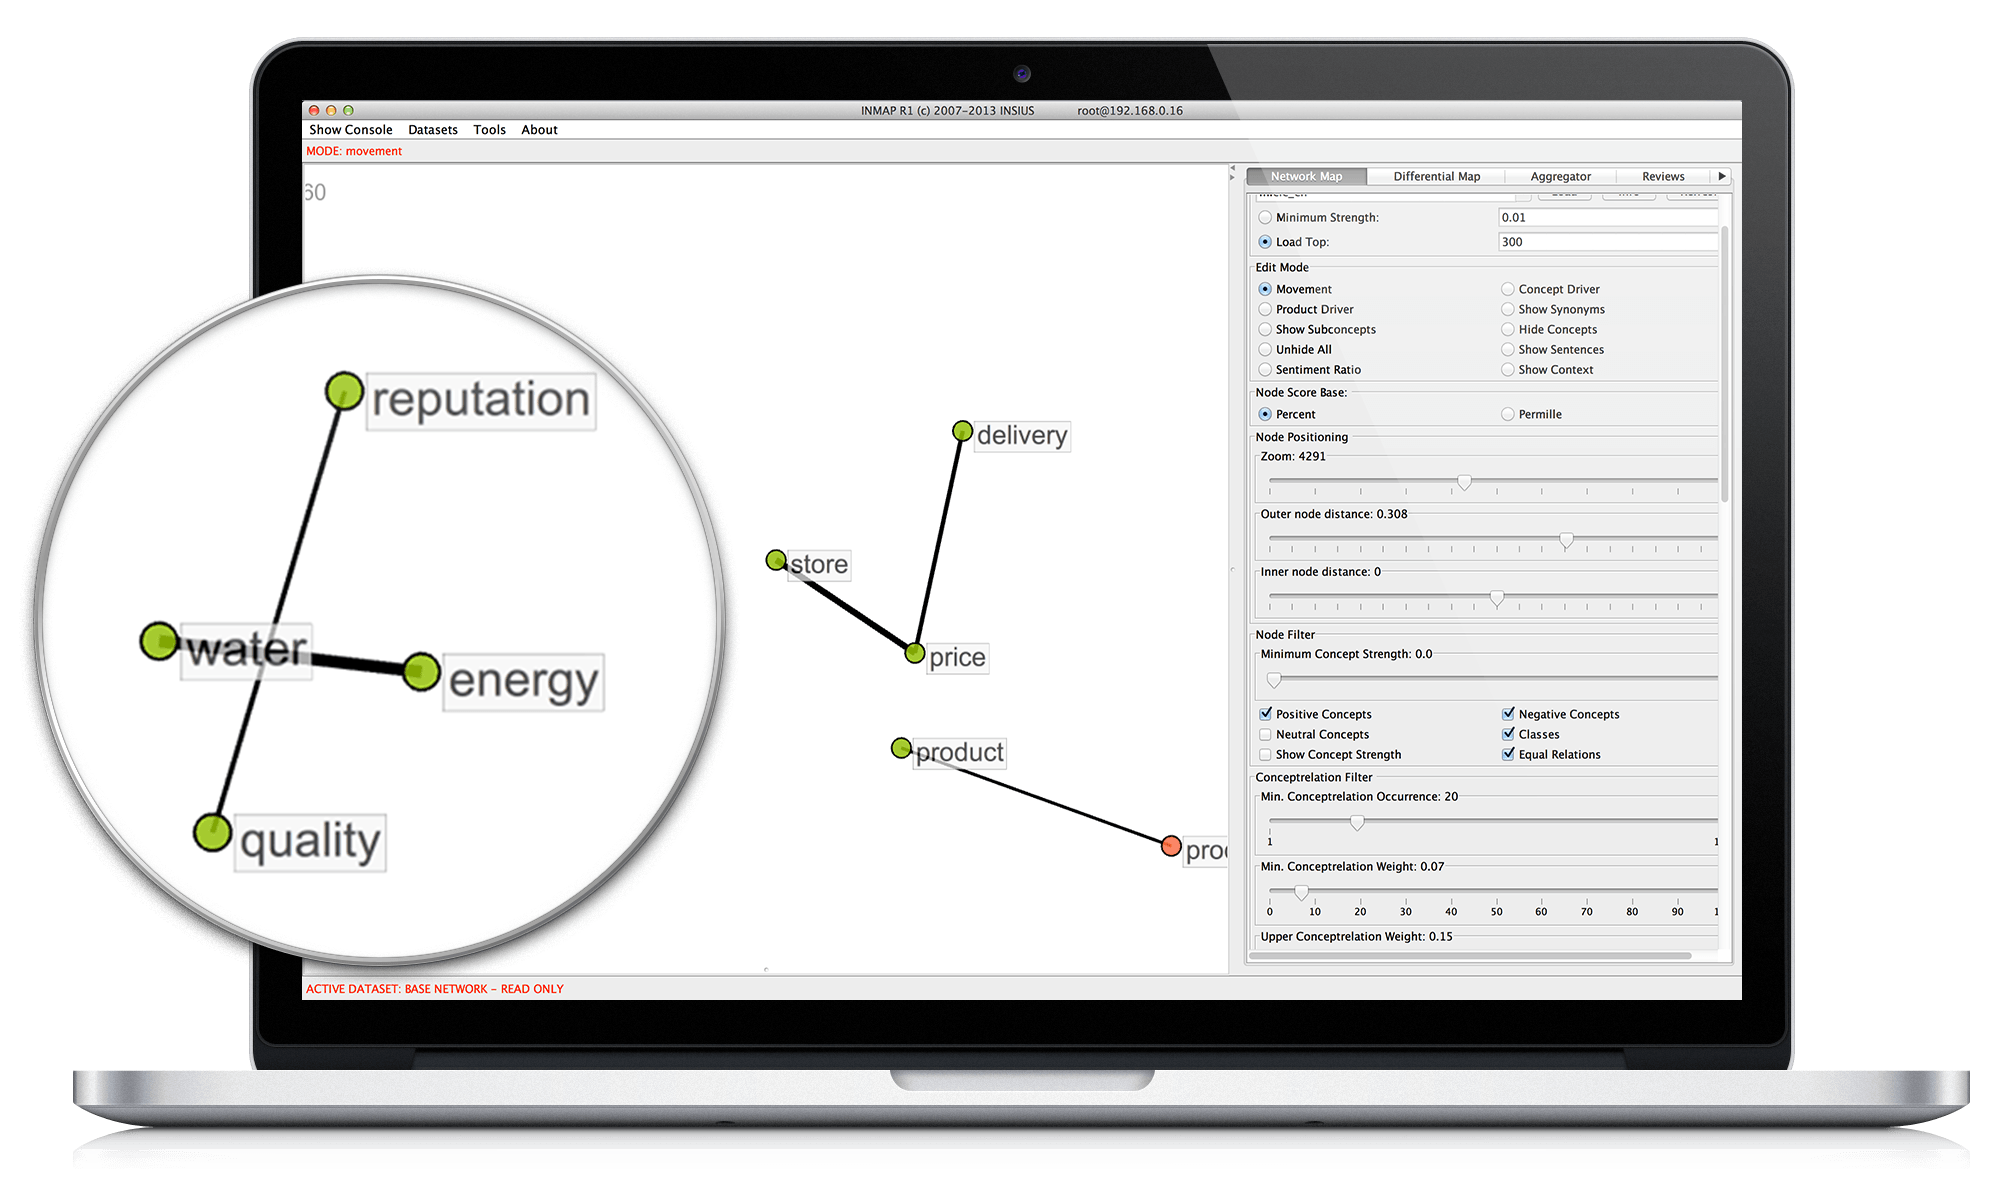
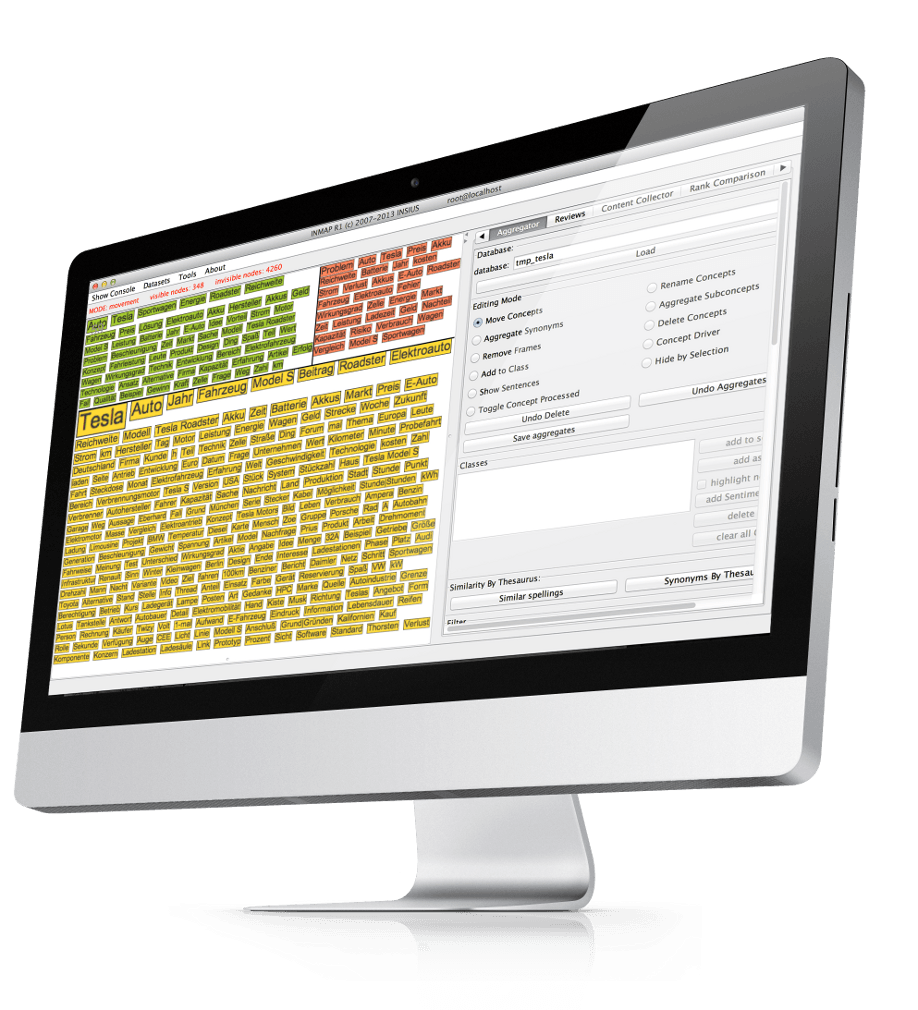
The focal point of InMap is the concept network map. The concept network map helps you to understand which positive and negative topics online consumers on the Web are concerned about and which thought patterns can be determined from online discussions. Every result can be conveniently traced back to its origin, drilled down, segmented and — in case of errors — eventually corrected.
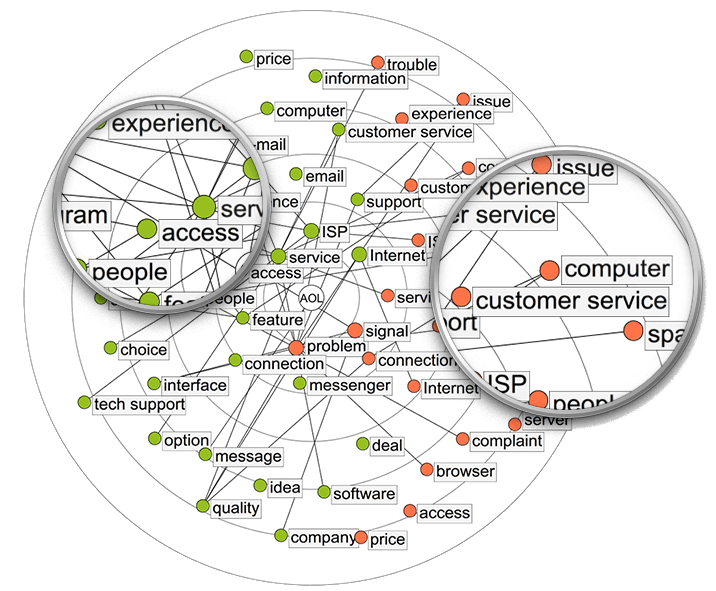
InMap uses state-of-the-art natural language processing algorithms to elicit the concepts that detail important topics for consumers on the Web. These concepts do not need to be manually defined in advance but rather are automatically found using algorithms. The concepts' strength in consumer perception can be easily read in the map. The closer the concept is located to the center of the map, the stronger the consumer association.
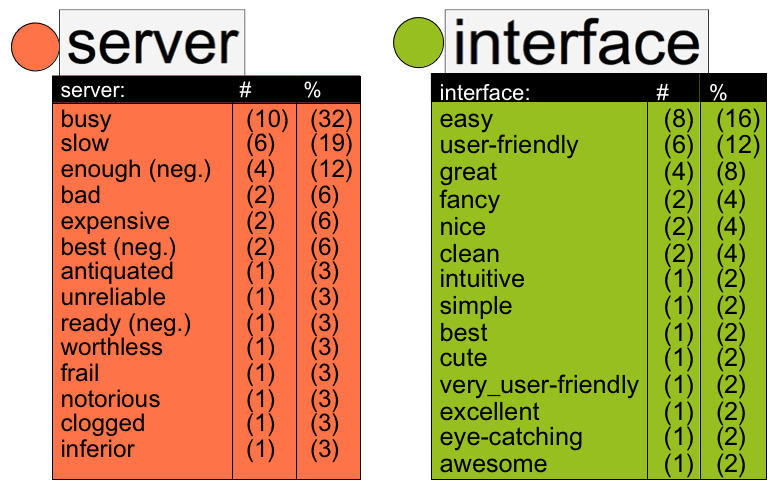
InMaps sentiment analysis is fundamentally different from traditional approaches in which the sentiment (positive/negative) is determined for a document as a whole. In contrast, InMap uses a fine-grained detection method. Why? Most of the time, discussions on the Web are differentiated, mentioning positive as well as negative aspects (e.g. for a product), which prohibits assigning one sentiment for an entire document. Therefore, InMap determines the sentiment down to the level of a single utterance or even the level of attributes and concepts. This enables you to learn which topics consumers highly regard, which aspects are criticized and most importantly: why.
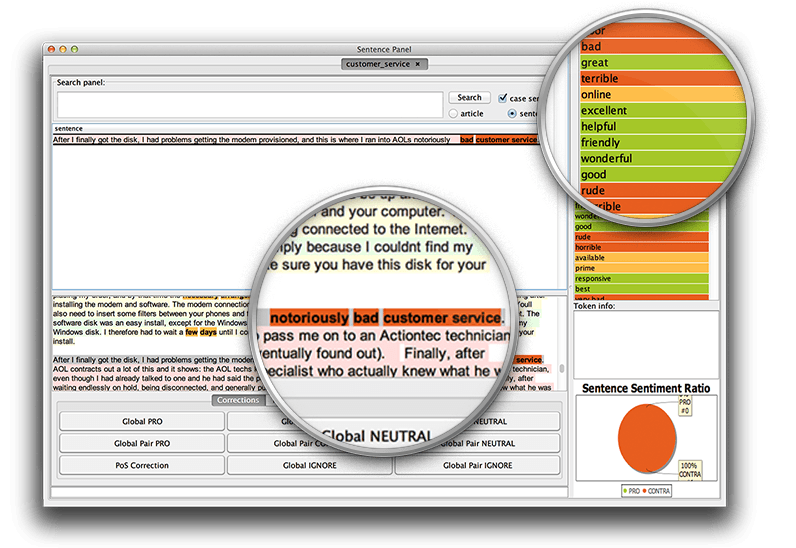
InMap allows you to obtain the reasons why certain concepts are positively or negatively discussed. Depending on the context of discussion these reasons can be evaluated differently. For example, consumers might discuss the concept of "battery life" in the negative because they perceive "battery life" to be "short". In contrast, the "charging time" is also perceived as "short", but in this case the consumers' attitude is positive. InMap is able to automatically recognize these contexts and consider them while determining the sentiment. We call this domain specific sentiment analysis.
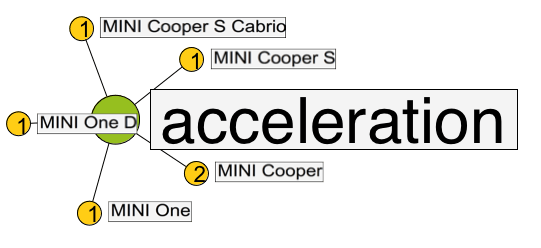
For each concept, InMap enables you to retrieve which products are relevant and determine the discussion topic. For example, the concept "creamy" is mainly discussed in a chocolate brand discussion, for example with the Cadbury Diary Milk Chocolate product, while Cadbury Peppermint Block resonates with the concept "fresh". InMap also allows you to even detect which products are responsible for multiple concepts, so Cadbury Jelly Crunchie Bits might be "fruity" as well as "crunchy".

The InMap Source Driver Analysis enables you to retrieve which webpages and communities predominantly discuss a certain topic in a certain tonality. For example, the concept "nutrition" might be mainly discussed on mothersboard.com, while users discuss "prices" on productreviews.com.
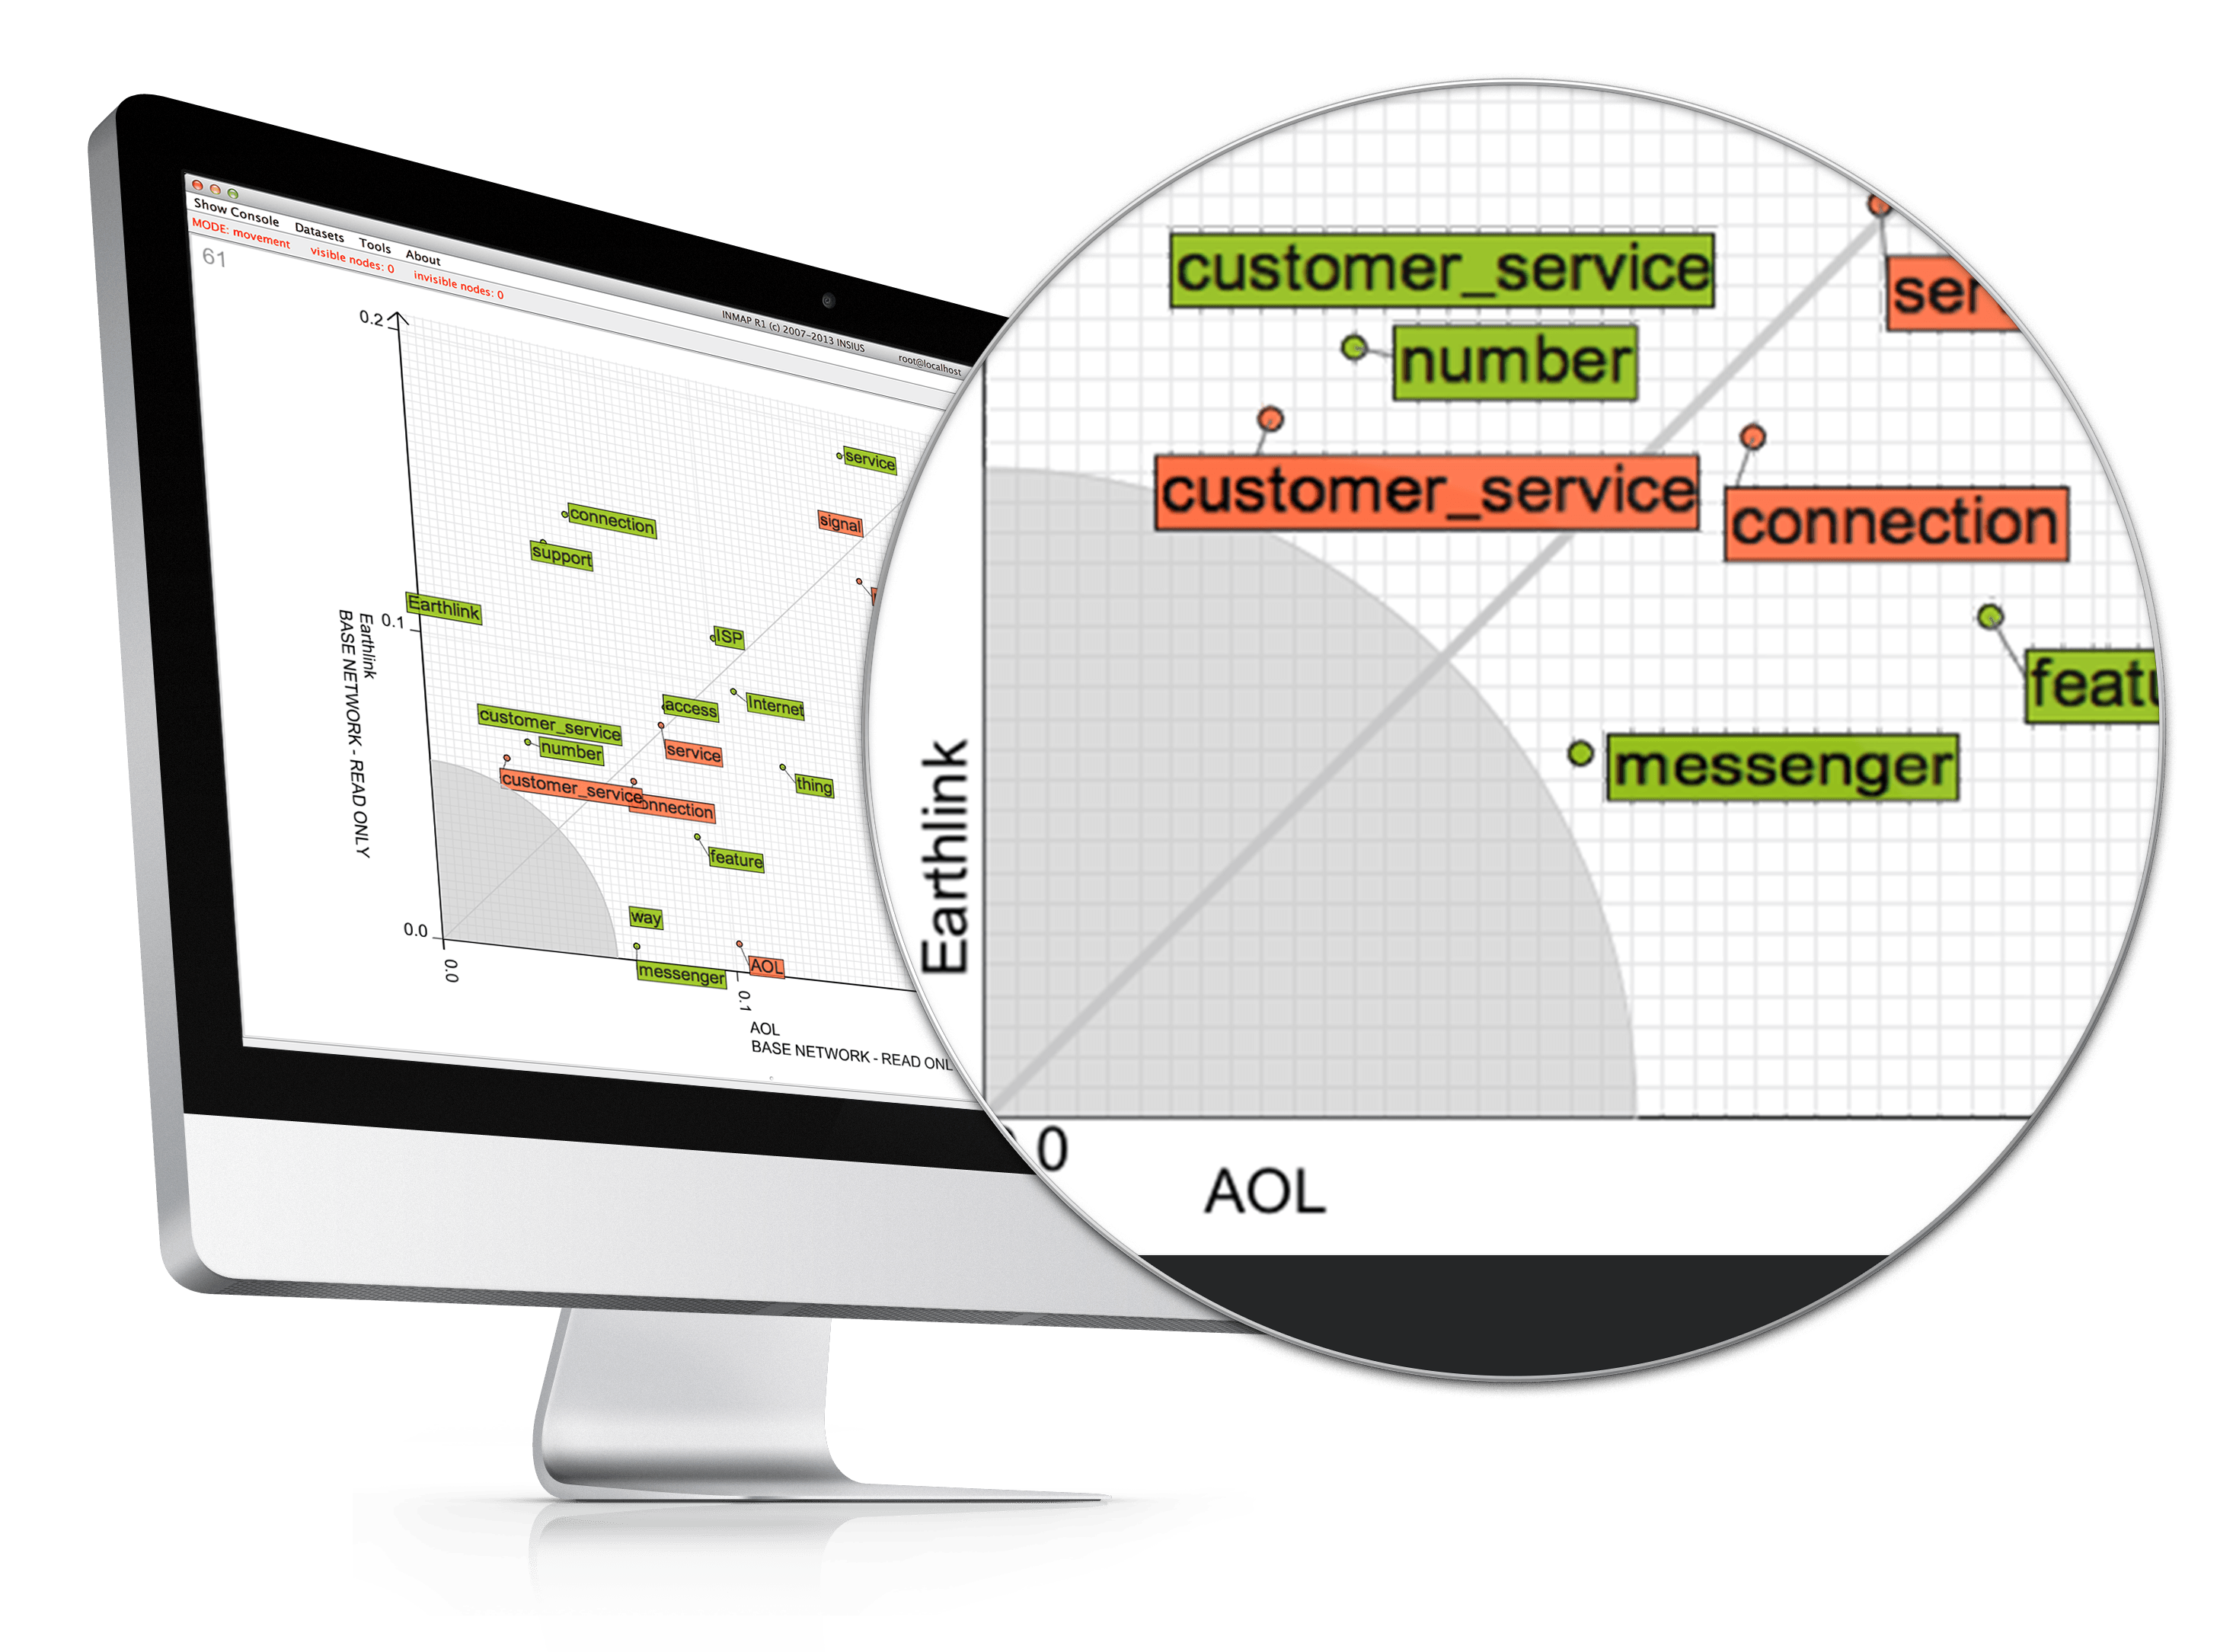
Although analyzing consumer perception regarding your brands, products or topics of interest already grant deep insights, opposition and benchmarking across your competitors’ brands, products or similar topics is even more important and insightful. InMap Differential Analysis allows you to directly and conveniently oppose and benchmark research subjects (such as other brands, products, topics) to determine your strengths, weaknesses or distinguishing features across your competitors.
When analyzing a large number of online consumer discussions, patterns might be found from a bird’s eye view. InMap is able to detect patterns of concepts and topics and reveal which of those topics are eventually connected in the minds of the consumers discussing online and describe their thought patterns. This information allows you to detect which topics might be triggered by marketing activities to activate the maximum number of positive associations.
Most of the time consumers use different words to describe the same topic. For example the topic "price perception" incorporates statements of "cheap", "pricy" or other high/low costs. InMap allows you to aggregate different concepts into groups of themes and reveal the true discussion intensity of topics.
Using automated algorithms always bears the risk of misclassifications and analysis errors. InMap allows you to conveniently detect and correct potential errors. Best of all: InMap learns from your corrections for future analysis.
InMap allows you to interactively segment your data by any criteria. Results are computed and shown in real time. You can also oppose and benchmark your segments.
For example, you are able to reveal the differences in consumer perception from the year 2012 to 2013 by creating live segments for 2012 and 2013 and use InMaps Differential Analysis to reveal differences and similarities.
Next to common export functions such as Excel, CSV or PDF you have the ability to unlock your analyses for your customers. The Web-based InMap Browser allows your customers to interactively drill down into topics and the quantitative results of your InMap analyses. It’s your choice which and down to what detail level your analyses are visible for your customers.
Subscribe to our newsletter and stay up to date with the latest news!
2020 © Insius. ALL Rights Reserved. Site Info Privacy Policy